DES AVANTAGES POUR LES MEMBRES DU PERSONNEL ET LEUR FAMILLE
Le mieux-être au travail simplifié.
Nous sommes déterminés à créer les milieux de travail les plus sains au monde. C’est pourquoi nous offrons aux employeurs tout un éventail de services et d’outils qui contribuent à la santé, au bonheur et à la productivité de leur équipe.

Une entreprise florissante commence par une main d’œuvre en santé.
Une expérience de soins de santé de bout en bout.
Que ce soit par des soins virtuels ou en personne, pour la santé mentale ou pour la santé physique, jusqu’aux séminaires de planification financière pour les employés et aux stratégies de réduction des coûts pour les employeurs, nous nous concentrons sur votre bien-être.
Bonifiez votre régime d’avantages.
Notre équipe multidisciplinaire propose une expérience personnalisée qui permet à vos employés de recevoir les soins dont ils ont besoin, quand ils en ont besoin.
Aidez à attirer et retenir les meilleurs talents.
En faisant du bien-être une priorité, les organisations peuvent mettre en place une culture positive et présenter une proposition de valeur éloquente qui aidera à attirer ou à retenir les meilleurs talents.
Des soins complets pour l’ensemble des employés.
Notre offre de services peut contribuer à soutenir la santé mentale, physique et financière des organisations et de leurs employés.


Des solutions simples et personnalisées dans un environnement de bien-être complexe
Que vous ayez besoin d'une solution ou de plusieurs, nous pouvons personnaliser un package qui répond à vos besoins actuels et qui peut évoluer au fur et à mesure que vos besoins évoluent.
Les avantages sociaux, un atout important.
Le bon programme de santé et de bien-être, conçu expressément pour votre organisation, peut contribuer à la productivité, à la motivation et à la rétention de votre personnel. Nos services virtuels ou en personne, visent à fournir aux employés un accès pratique et global aux soins pour soutenir leur bien-être.

RH et gestionnaires des avantages sociaux.
Faites cadeau aux membres de votre personnel d’un accès fiable et confidentiel aux soins, pour eux-mêmes et pour leur famille :
Inscription aux avantages en ligne.
Soutien et soins virtuels, en personne ou sur place.
Accès à une équipe dévouée composée d’experts des produits, prêts à répondre à vos questions.
Propriétaires d’entreprise.
Aidez à protéger le bien-être et la santé de vos employés pour favoriser la productivité et améliorer la rétention de votre personnel.
Aidez à attirer et retenir les meilleurs talents grâce à des expériences de soins personnalisées.
Formez une main-d’œuvre productive et résiliente en proposant un accès direct à des professionnels de la santé.
Adoptez une approche préventive en matière de soins en aidant votre personnel à atteindre un meilleur équilibre travail-vie personnelle.

Prêt à passer à l’action?
Comment se porte votre personnel?
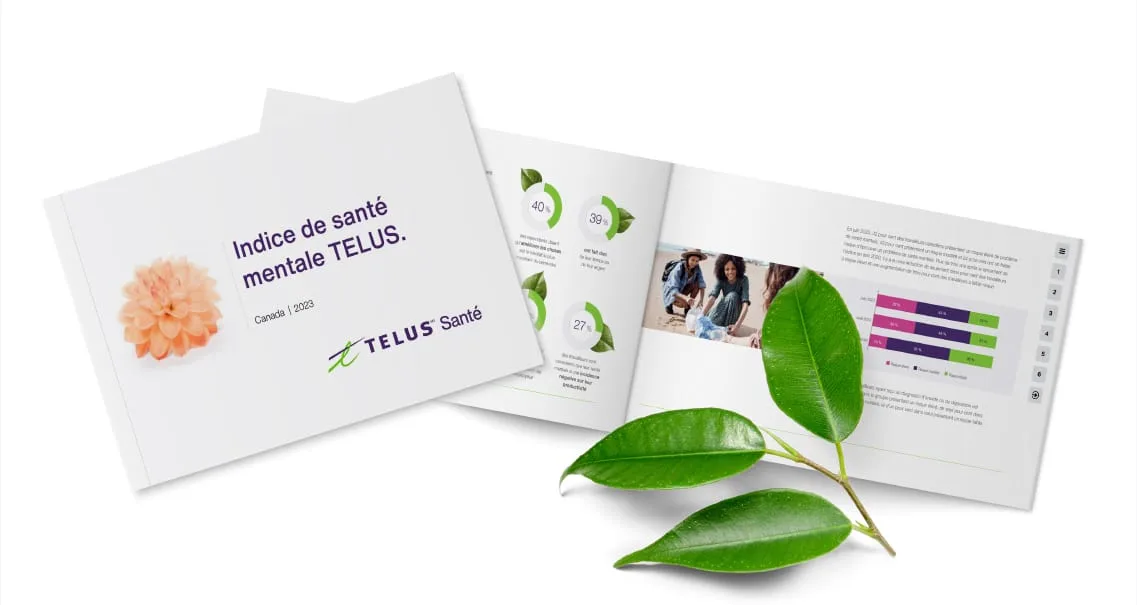
Notre Indice de santé mentale sonde 16 000 travailleurs à travers le monde sur leur état de santé mentale dans le but d'aider les employeurs à mieux soutenir leurs effectifs.

Prêt à passer à l’action dès maintenant?
Communiquez avec notre équipe des ventes pour discuter de vos besoins.